

Analytics
Analytics turns an Agent’s activity into counts and trends: how much it is being used, which parts of it people reach, and what that usage costs in credits.
Purpose
Read an Agent’s usage over a period, break it down by the dimension you care about, and export the underlying data.
Prerequisites
- An Agent that has answered questions during the period you want to look at.
- A plan that includes analytics.
Steps
Open Analytics
Select Analytics in the left-hand navigation. The page opens on the last seven days, showing four figures across the top and a chart of usage over time below.


Read the Four Figures
The information icon on each card explains how the figure is derived, including which client types it can and cannot count.
If the fourth card offers an Enable CTAs button instead of a percentage, no Agent on your team has calls to action turned on. There is nothing to measure yet, rather than a rate of zero.
Set the Period
Date Range takes a preset or two dates. Everything except Monthly Active Users follows it.
Widen it before drawing conclusions. Seven days of a quiet Agent looks like a flat line; the same Agent over thirty days usually shows a shape.
Choose What to Count
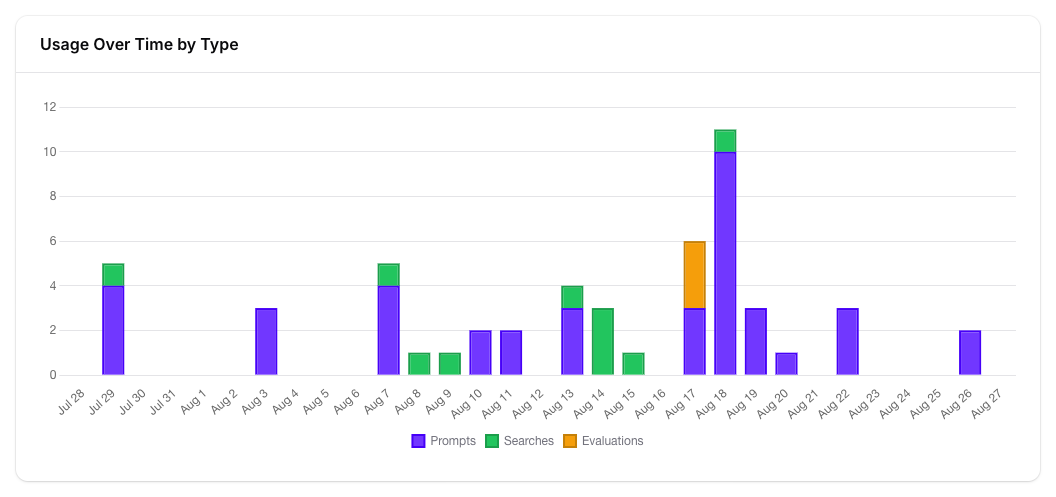
Metric switches between Count, the number of things that happened, and Credits, what they consumed. Count answers “how busy is this Agent”, Credits answers “what is it costing”.
Usage Types selects which of Prompt, Search, and Evaluation are included. All three are on by default.
- Prompts are questions answered.
- Searches are semantic searches against your content, through the API or in-chat.
- Evaluations are guardrail, call-to-action, and benchmark checks run against responses.
Break It Down
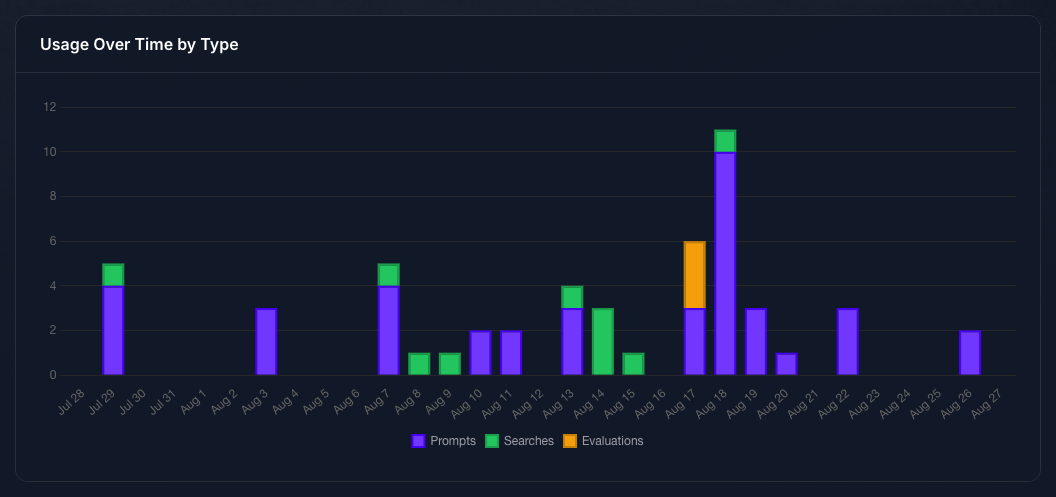
Group By decides how the charts are split. It defaults to Usage Type and offers four families:
Grouping by client shows where people reach the Agent: its own site, an embedded widget, the API, a messaging channel, or a benchmark. Grouping by model is how you see what your credits are being spent on, particularly with Metric set to Credits.
Turn on Exclude Empty Values to drop rows where the dimension is not set. It is worth using on Demographics, where location is often unknown.
Narrow to a Subset
Filters limits the data before it is grouped, using the same families as Group By plus an Evaluations tab. The Engagement tab also filters by prompt tags. Filtering to one Agent and grouping by client is the usual way to answer “how are people reaching this Agent”.
Select Apply to commit the change.
Export the Underlying Rows
Export downloads the data behind the charts as a zip of CSV files, one per usage type. Use it when you need a figure the page does not show, or want to chart something yourself.
The export honours the filters and date range on screen.
The evaluations file is the only place the prompt tags an Automation applies are readable: Result Tag holds the tag chosen for each prompt. No Group By option shows them, and Evaluation Result sorts into Passed and Failed rather than into your tags.
Expected Result
You can see how much an Agent is used over any period, split by the dimension you care about, and export the rows behind any figure.
Analytics Counts More Than Chat Logs Shows
Moving from a figure here to the conversations behind it is the usual investigative path: notice a spike or an unfamiliar client, then read the exchanges in Chat Logs. It works for prompts, and only for prompts.
- Searches and evaluations have no equivalent in Chat Logs. They are activity, not conversation, so there is no per-record view of them. Filter Usage Types to Prompt before comparing a total here against that list.
- Benchmark prompts are counted here and hidden there. A benchmark generates real prompts and answers, and they appear in these charts under the Benchmark client type, but Chat Logs deliberately omits them. An Agent that has run benchmarks will show more prompts here than Chat Logs lists.
Nor do the two always agree on very recent activity. Analytics reads a summary that is refreshed periodically, so an exchange can be readable in Chat Logs before it is counted here. Give it a little time before treating a discrepancy as a fault.
Troubleshooting
- Analytics is not in the navigation. It is a plan feature. Check your team’s subscription.
- The chart is flat or nearly empty. Widen the date range. The default is seven days.
- Only one usage type appears. The other two only appear on days they happened. Searches need the search API or in-chat search; evaluations need guardrails, calls to action, or a benchmark run.
- The client breakdown shows only one client. Client type is determined by how the request arrived. An Agent reached only through the API reports only API traffic.
- The prompt count is higher than the number of exchanges in Chat Logs. Benchmark prompts are counted here and excluded there, and searches and evaluations are not exchanges at all.
- Monthly Active Users does not match the date range. It is always the 30 days ending on the period’s end date, by design.
- CTA Click-Thru Rate shows a button instead of a number. No Agent on the team has calls to action enabled.
Next Step
Continue to Custom Tracking Scripts to report visitor behavior on the Agent’s own site to your analytics tools, which is a different view again from the server-side activity counted here.